To begin, the expansion to the Panama Canal was completed in 2016, so some of the traffic that used the ports of Los Angeles and Long Beach is probably now going through the canal. This might be impacting TEUs on the West Coast.
Container traffic gives an idea about the volume of goods being exported and imported — and usually provides some hints about the trade report, since the LA area ports handle about 40% of the nation’s container port traffic.
To remove the strong seasonal component for inbound traffic, the first graph shows the rolling 12 month average.
LA Area Port TrafficClick on graph for larger image.
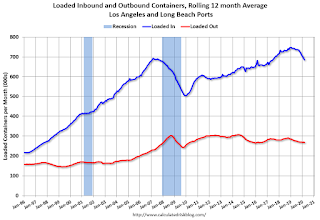
On a rolling 12 month basis, inbound traffic was down 1.1% in March compared to the rolling 12 months ending in February. Outbound traffic was down 0.7% compared to the rolling 12 months ending the previous month.
The 2nd graph is the monthly data (with a strong seasonal pattern for imports).
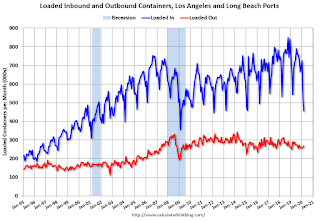
LA Area port traffic imports peak in the July to October period, as retailers import goods for the Christmas holiday, and then decline sharply and bottom in February or March, depending on the timing of the Chinese New Year (January 25th in 2020).
Because of the timing of the New Year, traffic would be expected to decline in February (without an impact from COVID-19), but bounce back in March (didn’t happen this year).
In general, imports (both imports and exports) have turned down recently — and will probably be negatively impacted by COVID-19 over the next several months.