Brief
Publicly available tools help companies spot patterns in one country or region that will likely repeat elsewhere.
At a Glance
√ Copious data from search engines and ad platforms can help marketers navigate a wise course during and after the pandemic.
√ Google Trends data showing demand for product categories in countries where the coronavirus has already peaked will predict demand shifts in other countries over the coming weeks.
Given the major health risks posed by Covid-19, along with the financial damage many people worldwide are suffering, consumption behavior has shifted dramatically. This directly translates to changes in media consumption and online search behavior.
How should marketers make informed responses? A wealth of readily available data from search engines and advertising platforms can help marketers and business leaders navigate a wise course during the pandemic and prepare to accelerate coming out of the crisis. Three tactical areas in particular will yield immediate benefits. While most of the data featured here comes from US markets, the analyses apply to any country.
1. Use Google Trends as a leading indicator
During this unusual period, with its dramatic swings in search behavior, Google Trends data serves as a fairly reliable predictor of consumer demand next week or month. Researchers now have a rare opportunity to chart geospecific behaviors to predict imminent declines and bounce-backs.
A simple analysis of product category searches through Google Trends illustrates these swings.
In many categories, we see a correlating drop in search volume among countries with a similar infection curve, including the US, Italy, Spain and the UK. Meanwhile, search activity in South Korea and China has begun to show signs of returning to baseline.
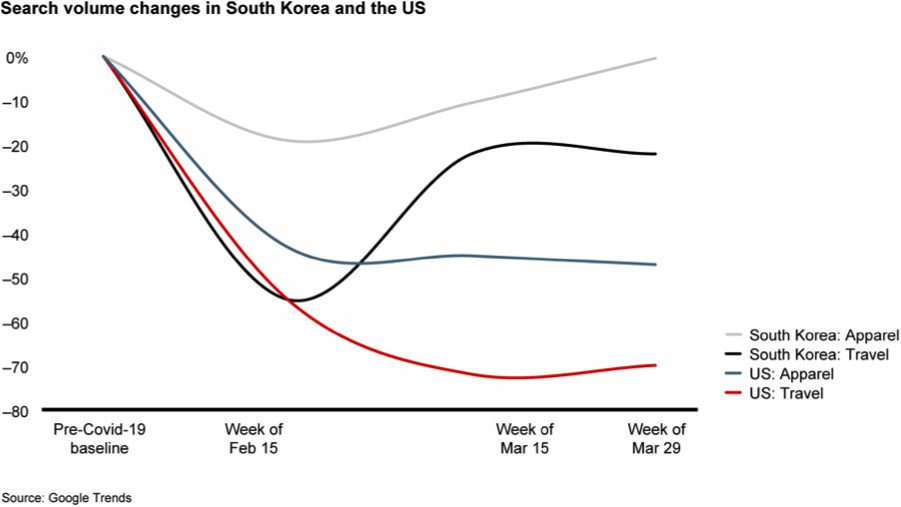
For example, as of March 29, US travel category searches had declined 70% from their pre-crisis baseline. Travel category searches in Italy have also dropped 60% in recent weeks, though the declines began earlier than in the US, following the spread of the virus. South Korea shows a slightly different pattern. In mid-February, travel-related searches had declined about 55% from the previous month, yet they have since rebounded by more than 30 percentage points (see Figure 1).
Figure 1
Google Trends data helps predict consumer demand next week or month
For categories like travel and apparel, where consumer demand has dropped sharply, companies should pay special attention to search volume trends in regions where the incidence of Covid-19 cases has slowed. Johns Hopkins University reports that South Korea’s confirmed cases peaked on or around March 5. Search volume, and by inference consumer demand, began to rebound over the following few weeks. According to the University of Washington’s Institute for Health Metrics and Evaluation, US cases will peak the week of April 12, suggesting that consumer demand could start to rebound the first week of May and return near baseline in the first weeks of June.
How this applies to marketing decisions will, of course, depend on the industry and geographic location. Apparel and travel searches may be down, but searches for toys and games, online learning, consumer electronics and other home-related categories have increased, in some cases more than twofold. As marketers plan investments for digital channels, search data by city can provide a useful guide.
A practical search-trends plan for a US company might look like this:
- Search on your brand and related category terms over the past 13 months. Note the decline or increase year over year, and during the past 4–6 weeks.
- Do the same for countries such as Italy, South Korea and the UK, as well as for different regions within the US. Use Baidu Index for China-related trends information.
- Apply the variation in predicted volumes to your original April and May advertising budget.
- Project total impressions by keyword (your total impressions divided by impression share) within the Google Ads platform. Compare that to Google Trends–predicted volume in order to continually refine for the upcoming week.
- As you advertise, plan budget reviews at least twice weekly through April and possibly beyond.
2. Harvest data now to relaunch your marketing plan later in 2020
While marketing team resources have been constrained over the past few weeks, they’re now shifting to prepare for the post-pandemic marketplace. Here’s what you can do now to plan for the second half of the year:
- Broaden insights about current and potential customers, possibly through a third-party panel or media partner. Match your CRM or internal audience data to track changes in customer behavior over the previous month. This will produce audience insights that can inform shifts in media channels, weights and creative content going into the third quarter.
- Assign a small team to analyze shifts in conversion and engagement rates over the past four to six weeks, as well as to evaluate media investment from early 2009 into 2010. According to Kantar Media, ad spending declined about 15% in the first three quarters of 2009, then jumped 10% higher than the former level by mid-2010.
- Put your owned assets in order by asking a few questions: How are our website and social assets performing? How can we reduce bounce rates and boost conversion rates by improving navigation and functionality? How can we enhance the mobile app experience to raise user engagement and retention?
- Fix the plumbing. In the course of day-to-day business, the rigor of certain marketing operations often slips. Now is the time to tighten standards again. Standardize campaign naming for ease of reporting and interpretation of results; revisit the input, quality and use of customer and campaign data; reassess marketing technology investments; and evaluate the yield of vendor and agency relationships.
Consumer demand has been shifting quickly in the wake of the pandemic. But the shifts are neither random nor unique. They happened somewhere else a few weeks ago. Search engine and ad platform data provide raw material for pattern recognition, allowing marketers to keep pace with or even anticipate the next turn of category demand.
Source: Bain & Company