Notes: i) The expansion to the Panama Canal was completed in 2016, so some of the traffic that used to use the ports of Los Angeles and Long Beach, is probably going through the canal, and ii) This might be impacting TEUs on the West Coast.
Also, incoming port traffic is backed up significantly in the LA area, with around 50 ships at anchor waiting to unload.
Container traffic gives an idea about the volume of goods being exported and imported – and usually provides some hints about the trade report, since LA area ports handle about 40% of the nation’s container port traffic.
The following graphs are for inbound and outbound traffic at the ports of Los Angeles and Long Beach in TEUs (TEUs: 20-foot equivalent units or 20-foot-long cargo container).
To smooth the strong seasonal component for inbound traffic, the first graph shows the rolling 12 month average.
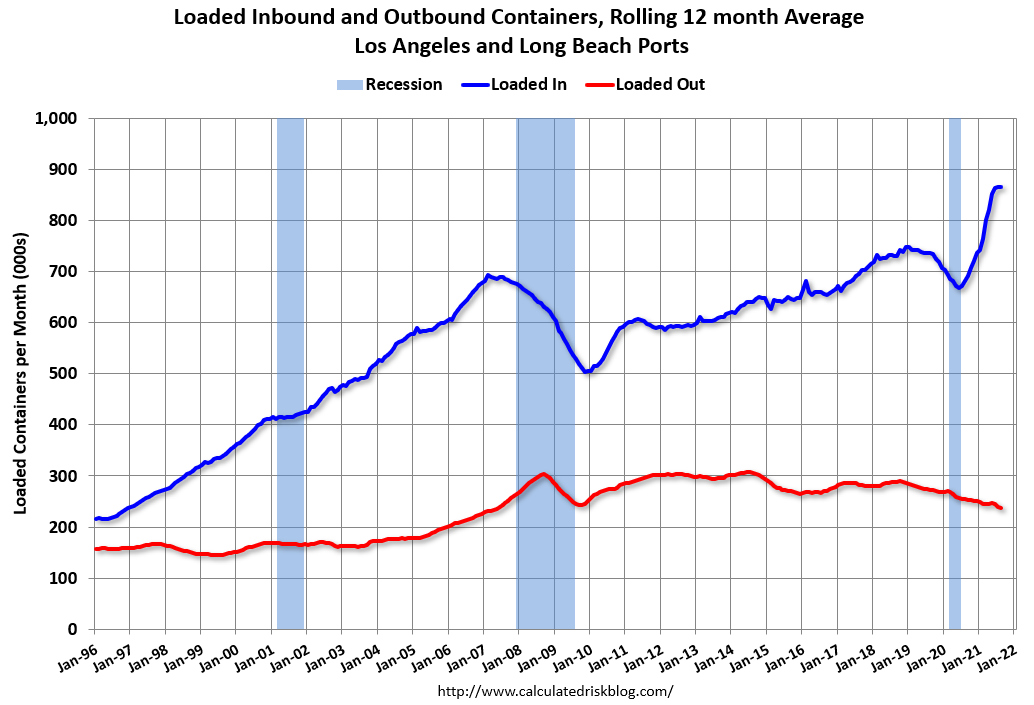
On a rolling 12 month basis, inbound traffic was up 0.1% in August compared to the rolling 12 months ending in July. Outbound traffic was down 1.3% compared to the rolling 12 months ending the previous month.
The 2nd graph is the monthly data (with a strong seasonal pattern for imports).
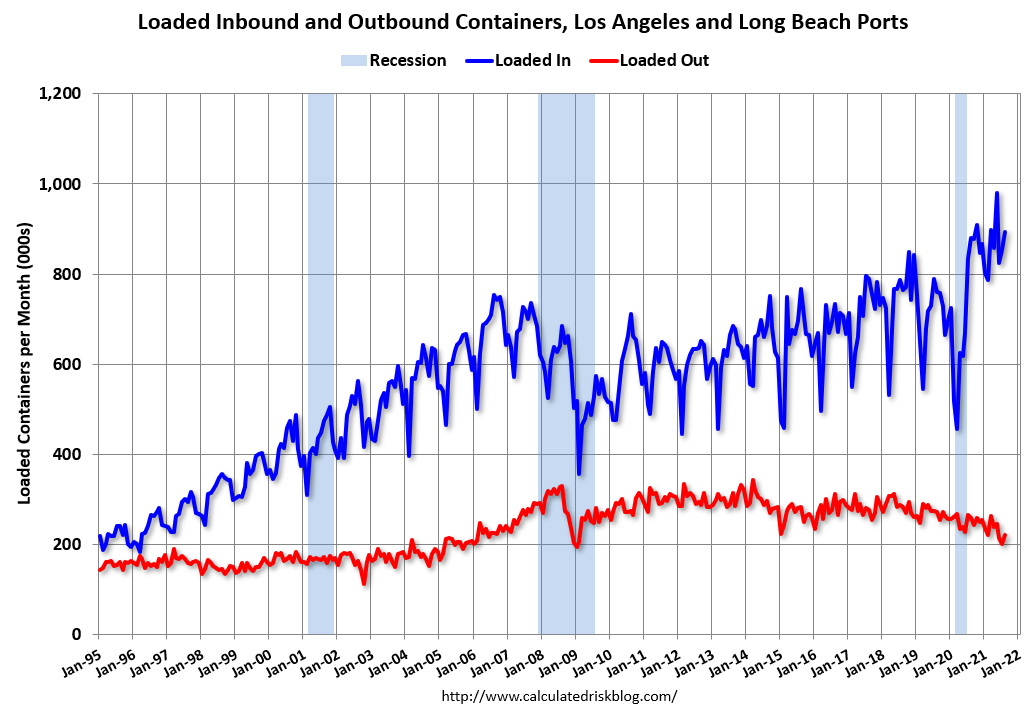
Usually imports peak in the July to October period, as retailers import goods for the Christmas holiday, and then decline sharply and bottom in February or March depending on the timing of the Chinese New Year.
Imports were up 1% YoY in August (recovered last year following the early months of the pandemic), and exports were down 14.0% YoY.