Top-line revenue growth is central to creating shareholder value. Studies consistently show that approximately 60 percent of total shareholder return (equity appreciation plus dividends) is created by revenue growth, nearly triple the contribution of cost reduction.
However, revenue growth does not come easily. Selling is a challenge due to stagnation in markets, customers who are more informed and demanding than ever, more complex buying processes, and competitors who have upped their game.
With access to company data and the ability to ask tough questions even in good times, CFOs stand in a unique position to help flailing sales and marketing organizations improve their effectiveness. Few CFOs, however, have direct experience leading a sales organization and are hesitant to make changes for fear of sparking the departures of sales talent and important customers.
Why are CFOs hesitant to jump into the sales conversation? We believe it is the dearth of metrics. CFOs are intimately familiar with financial metrics such as days sales outstanding, debt coverage ratios and free cash flow, but there is no similar standard set of metrics for evaluating sales and marketing performance.
A robust set of sales and marketing analyses would give CFOs the facts they need to ask insightful questions. Based on interviews with CFOs and our work with more than 300 companies, we have identified 25 fact-based analyses in four categories — sales and marketing effectiveness, market-share growth, growth outside the business core, and return on investment of sales and marketing expense — that can generate great questions. Below are three examples from the first category, the richest vein, of analyses conducted by CFOs that can lead to new insights on revenue growth and margin expansion.
Digging Into Customer Segments
Most thinking about growth occurs at such a high level that it’s impossible to see opportunities to improve. Meaningful insights sit at a deeper level of analysis. One of those deeper analyses involves deconstructing the revenue growth dynamics within each customer segment.
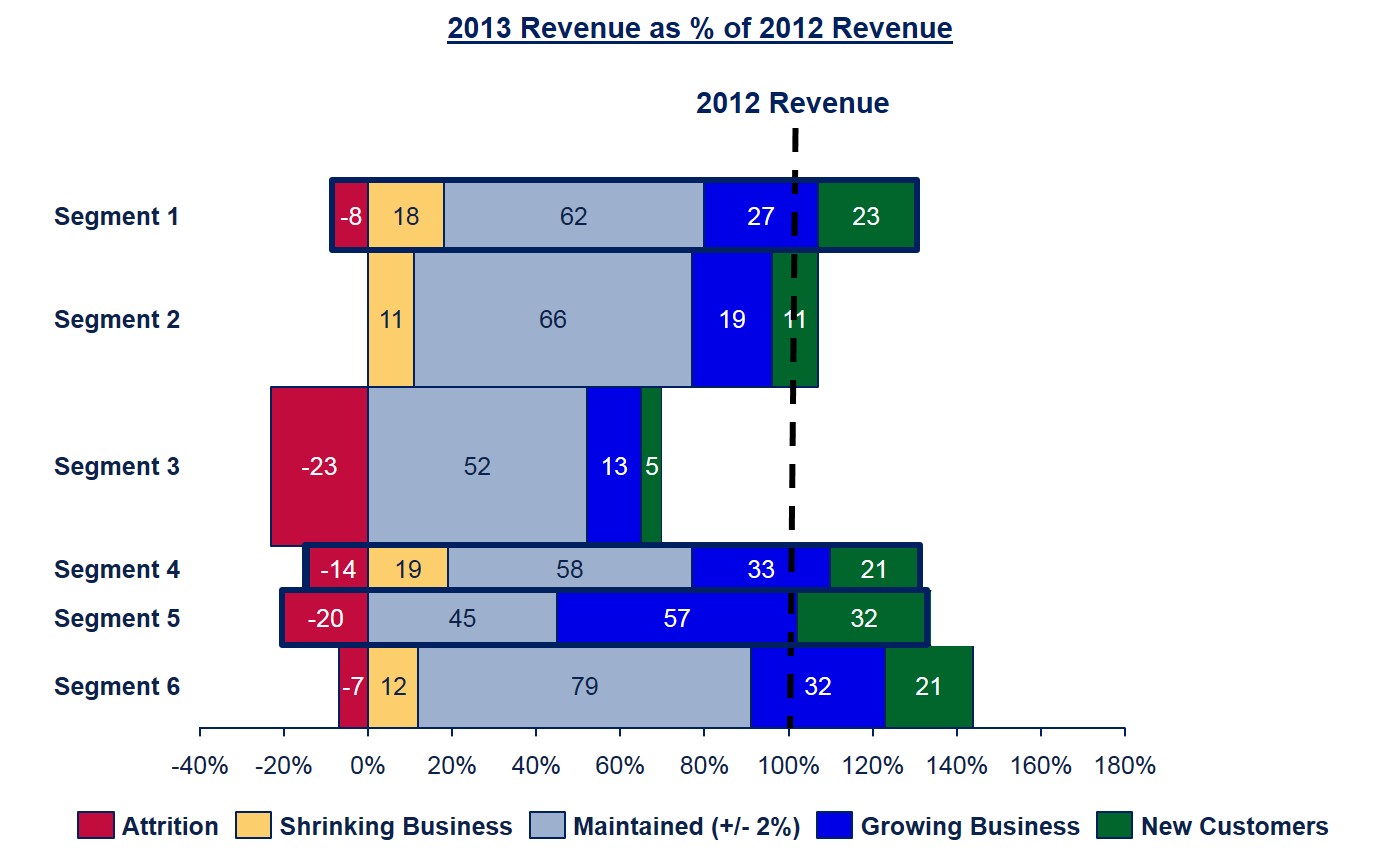
In the chart above, the CFO of an online corporate training company took six customer segments and, for each segment, analyzed the revenue impact of five customer types: 1) customers who attrited (in red); 2) customers with declining revenue (orange); 3) customers with relatively unchanged revenue (+/-2 percent) (gray); 4) growing customers (blue); and 5) new customers since the close of the previous year (blue). Total revenue in segment 3 (the largest segment, as indicated by the height of the bar) declined from 2012 to 2013 because the company lost customers who represented 23 percent of their 2012 segment revenue (the red portion of the bar). But that fact was already well known. The more interesting insights came from Segments 1, 4 and 5, because total revenue grew in those segments, masking other issues.
The CFO started asking questions. Why was customer attrition so high in these three segments, particularly in Segment 5 (20 percent)? Why was the business with so many customers shrinking, particularly in Segments 1 and 4? Were these revenue declines driven by product mix changes, pricing reductions, volume declines or some combination?
These turned out to be pretty good questions. When sales leaders dug in to find the answers, they discovered most of their lost customers had been lured away by the same competitor. They also uncovered the need to provide differentiated (higher) service levels to their most profitable customers, who were particularly vulnerable to competitors. Based on the findings from the CFO’s questions, the training company put programs in place to significantly reduce similar losses of customers and revenue in 2014.
Customer Pricing Disparity
Pricing can be difficult to manage. It’s hard to know if margin was left on the table because of low pricing or if volume was lost due to high pricing. Some companies wonder whether sales reps try hard enough to optimize price when incentive plans motivate sales to win new business with little emphasis on margins. In light of these issues, fact-based pricing analyses can produce important insights and great questions.
As an example, the CFO of a plastic components company completed the analysis above for one SKU. Each dot is the price point for a specific customer based on the volume of product purchased during the year (x axis). For example, look at the pricing dispersion at 1 million units per year. Price points range from $0.25 to $0.37 for the same product, at the same volume level. Also note that customers buying 11 million units per year are paying the same price as customers buying 1 million units per year.
While this might be an extreme example of undisciplined pricing, similar pricing issues exist at many companies. This one analysis led to great questions regarding the company’s pricing strategy, pricing approval processes, sales rep skills in communicating the company’s value proposition, sales incentive plans and the need for more systematic awareness of market prices. As a result of these discussions, sales reps were trained to better articulate the company’s value proposition, a “pricing czar” was put in place to oversee all aspects of pricing and marketing was tasked to better understand how the company’s prices compared to the market. These changes resulted in 800 basis points of margin improvement.
Territory Growth vs. Sales Rep Compensation
Many companies have trouble understanding whether each member of the sales team is effectively contributing to the growth and profitability of the company. Are sales reps driving for ever higher revenue growth and margin improvement each year? Are the best contributors to growth and profitability being well compensated? Are lesser contributors receiving lower compensation? Sales leaders will usually say yes, but sometimes the data reveal a different story.
The CFO at a packaging products company used the chart below to compare the EBITDA growth rates in each sales rep’s territory to the year-over-year change in their incentive compensation payments. The CFO discovered two things. First, most of the large territories were shrinking and the growth of the business was being fueled by the smaller territories. Second, most of the highest paid sales reps were responsible for the shrinking territories.
Armed with these findings, the CFO approached the chief commercial officer (CCO) with some thought-provoking questions. “Why are the large territories shrinking? Have we captured the available market share in these territories or do we need to change the way we attack the market? Why are we continuing to pay high compensation to sales reps who aren’t growing their territories?” Their discussions led to some important changes.
Following the CFOs probing, the company split the sales role between “hunters” and account managers; marketing undertook new efforts to understand the market size and the number of new sales targets in each territory; sales revised its approach to key account planning; and the organization made constructive changes to sales supervision, staffing levels and sales incentive plans. As a result, revenue growth accelerated from approximately 3 percent per year to 6 percent per year.
Those are just three high-value areas of analysis in sales and marketing effectiveness that CFOs can use to ask questions leading to acceleration in profitable revenue growth. As you undertake this effort, keep in mind that not all analyses will uncover high-impact opportunities. But by taking a hard look at these and other critical aspects of the sales function, CFOs will serve as even stronger thought partners to chief commercial officers, CEOs and boards on issues related to growth.